
Things began to look up in the month of March in terms of Missoula residential real estate activity. This, after the first two months of the year resulted in a slow start to the year, causing us to consider whether we were seeing simply a seasonal slowdown or the beginning of a stabilizing market for Missoula. Active listings, under contract numbers, and sales are all on the rise. With a recent influx of buyers actively looking for homes to purchase, we believe if more homes become available as we move through spring, there are buyers out there to absorb it.
The Missoula residential real estate market closed out the third month of 2014 with a total of 52 sales, with 87 percent of the homes sold priced under $350,000. The overall average sold price was $248,472 and homes that closed in March were on the market for approximately 98 days before the sale was finalized. At the end of the month there were 131 homes under contract and 350 homes actively listed for sale.
Buyer Recommendation: With continued low inventory and more buyers out looking, sellers whose homes are competitively priced have been entertaining multiple offers and getting very close to asking price or more. Prior to beginning or resuming your search, we recommend that you be prepared with a loan pre-approval letter and ready to look at and make an offer on the good homes immediately to avoid possible multiple offer situations. Average lender rates for mortgages have been increasing steadily and, if rates continue to rise, we anticipate a downward pull on affordability for buyers in the market for a new home. Be prepared to pay 97-98 percent of asking price, on average.
Seller Recommendation: With inventory at such low levels for the last several months, we recommend putting/keeping your home on the market, especially since there are currently more buyers in the market than we have seen in the last several months. Until more homes are listed for sale buyers will have increasingly limited options, thus creating the possibility of a seller getting an offer close to asking price because supply is not quite meeting demand. While it seems average sold prices could increase a little during this time, it is still very important to price your home reasonably and competitively.
HIGHLIGHTS
Supply & Demand
The inventory of homes listed for sale in Missoula increased to 350 at the end of March, coupled with an increase in the number of homes under contract to 131. There were a total of 52 residential sales for the month. While this is about 12 fewer homes than were sold last year in March, this is a 100 percent increase in sales from last month.
The Missoula market is still suffering from a lack of inventory. Despite the gradual rise in mortgage rates, the lack of inventory is helping sellers garner between 97 and 98 percent of asking price.
Price Range
Approximately 11.0 percent of inventory turned over this month, compared to 11.4 percent last month. Most of the sales activity (roughly 87 percent) occurred in the under $350,000 price range.
Days on Market (DOM)
There was a significant decline in the number of days-on-market for homes sold in March compared to DOM for homes sold in February. Homes that sold in March were on the market for an average of 98 days, compared to 192 days in February. This trend is due to slow home sales during winter months kept inventory on the market for long periods of time.
Foreclosure/Bank Owned (REO)
Short sale and REO properties accounted for only about 2 percent of the active residential listings this month. At the end of March, the MLS was reporting 6 active short sales and 2 bank-owned properties out of a total of 350 single-family listings.
Average Sold Price
Average sold price in March was $248,472, down approximately $5,400 from last month and down about $8,200 from January which had the highest average sold price since June 2013.
The following graph shows average sold price trends since January 2012.
Absorption Rate
The health of any real estate market can be recorded by absorption rates, which is the correlation between the number of active homes on the market and the number that sell per month, on average. According to the National Association of Realtors, a normal market is six months of inventory. For the purposes of this discussion we are utilizing a 3-month average for sales.
Overall, the Missoula market performed slightly below a normal market this month, producing an overall absorption rate of 9.1 months in March, compared to 8.6 months in February. Under contract figures increased a bit from February, indicating that at least some of the homes that were under contract in the last two months actually closed. The Missoula area experienced extreme weather in February which, we know in some cases, caused some closings to be delayed until March.
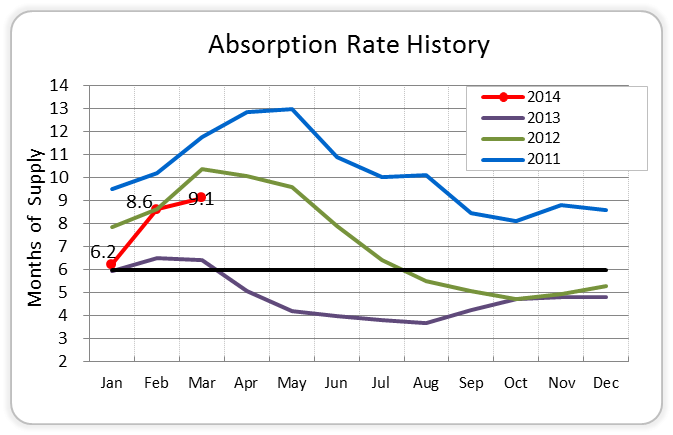
The increase in the number of under contract properties, reduced number of sales in January and February, and only a slight decrease in inventory likely nudged up the absorption rate. We have been speculating that low inventory over the last several months could be an indication of the Missoula market’s new “normal”. We have also considered that buyers have been doing one of three things: cancelling transactions because they unable to lock in an affordable rate before it rises; holding off buying and staying in their current homes; or, they waiting for more homes to come on the market (more choices). Whatever it is they are doing, it is clear there have not been many home purchases being made. However, March total sales doubled from February total sales and with warmer weather just around the corner, we have noticed buyers beginning showing interest in looking at homes again.
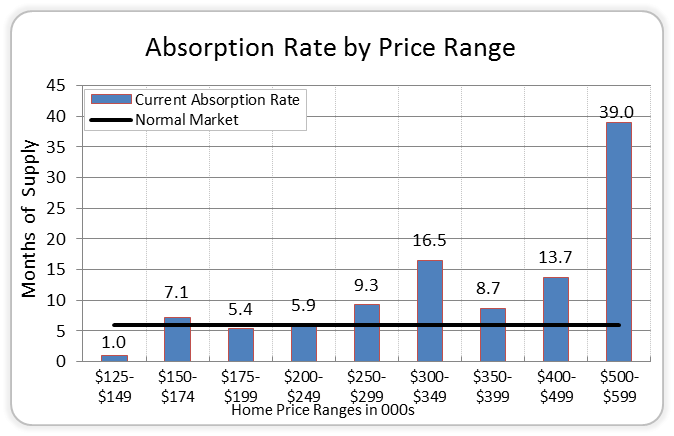
A low absorption rate in your price range may indicate an opportunity to list at a higher price and, conversely, a higher absorption rate in your price range may put downward pressure on your market value. The following graph demonstrates absorption rate by price range. This month, absorption rates generally increased at each price-change increase – with one exception – homes priced from $300,000 to $349,000. It is our belief that this price-range could be skewed a bit due to homes which are actively listed but not yet built.
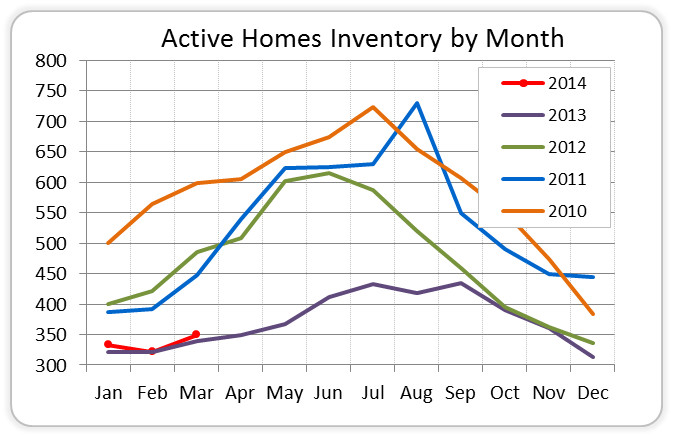
Inventory of Homes Listed for Sale
Over the last year Missoula has had a significant shortage of homes on the market. Even with seasonal increases in inventory, inventory levels have remained below that of the last few years. At the end of March there were 350 homes listed for sale.
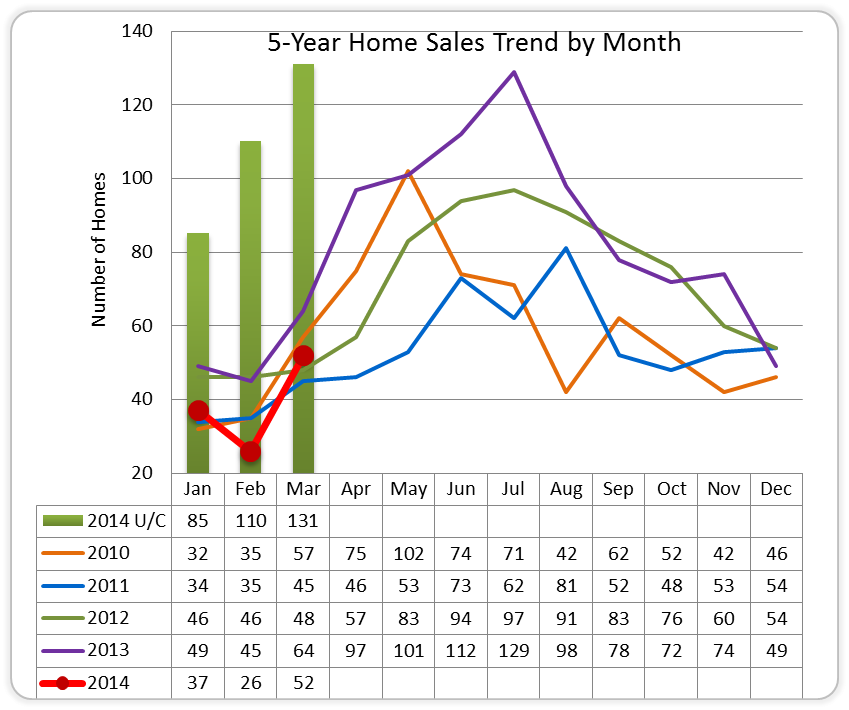
5-Year Home Sales by Month
Missoula home sales increased this month to a total of 52 and under contract volume increased from 110 properties at the end of February to 131 properties under contract in March. Based on the low number of sales in January and February, we believe there may have been some properties that were under contract at the end of January and February that did not end up closing until March.
The following chart provides a monthly snapshot of total homes sold since January 2010. (Green columns represent Under Contract properties for the current year.)
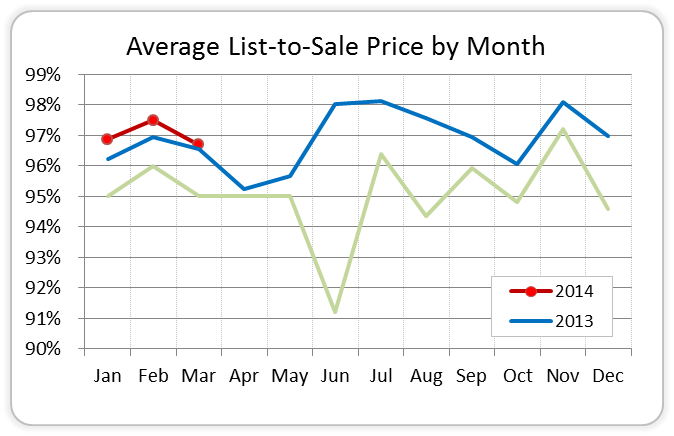
Average List-to-Sale Price
List-to-sales price, the ratio of the price at which a home sells to the price at which it was listed, signifies pricing trends in the market. (For example, if you sold a home for $100,000, sellers are, on average, accepting offers of $96,000 – $98,000, or between 2 and 4 percent less than asking price.) When inventory increases, average list-to-sales prices generally decrease due to added competition in the market. When lower list to sales prices are seen, usually in the summer months, it can be attributed to high absorption rates, primarily because during these months there are more homes on the market, meaning more competition. In that scenario, motivated sellers might have to take less for their home in order to beat out the competition.
For the last couple of years homes have been selling at 95 percent to 96 percent of list price and, for the last several months, list-to-sales price has been better than in prior years – hovering between 97 and 98 percent. The lowest list-to-sales ratio in the last year was in March 2013, when sellers averaged 95 percent of asking price. In the summer months following, this percentage moved up to 98 percent. List-to-sale price this March averaged 97 percent.
The following graph provides the average list-to-sale price, by month, for the last three years:
Overall Short-Term Market Outlook
With under contract numbers on the rise and a recent influx of buyers actively looking for homes to purchase, we believe we have been experiencing a winter market rather than a stabilizing market.
However, with inventory at such low levels we need to see sellers putting/keeping their homes on the market. Since there are currently more buyers in the market than we have seen in the last several months, buyers have limited options, thus creating the possibility of a seller getting an offer close to asking price. While it seems average sold prices could increase over the coming months, qualified buyers that are prepared to buy are also looking to purchase a reasonably priced home. Sellers whose homes are competitively priced have been entertaining multiple offers and getting very close to asking price or more than asking price. Sellers are currently closing the sale at an average of 97 to 98 percent of asking price.